Debugging Flows
FlowPilot gives you two views of a running flow: the FlowPilot Editor shows it live and lets you pause and step through it, and the in-game overlay draws it on screen. Both work during Play In Editor (PIE).
Watch a flow run in the editor
- Open the FlowPilot asset in its editor and press Play.
- When an instance of the asset starts, the editor follows it automatically. To pick another one, use the Debug Target dropdown in the editor toolbar: it lists every running instance by Actor name, including Sub Flows and multiplayer clients.
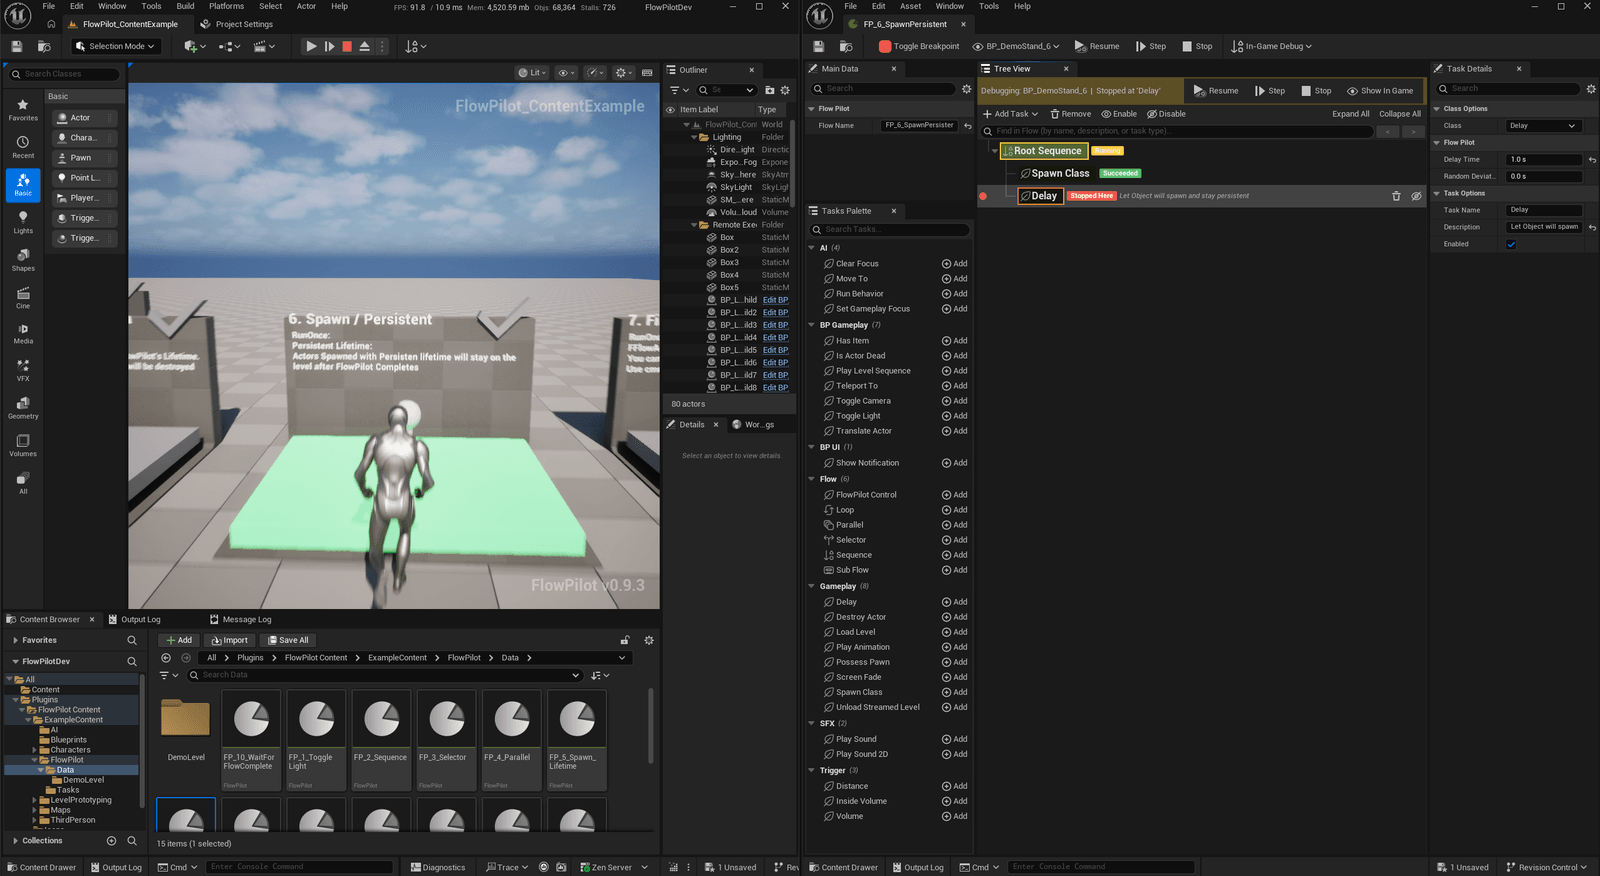
- A debug bar appears above the Tree View:
Debugging: BP_Door | Running.
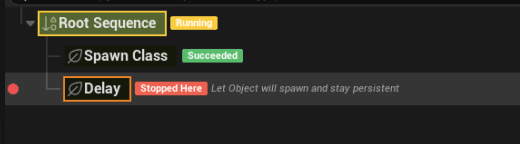
Each Task row shows its state:
| Badge | Meaning |
|---|---|
| Running (orange, row outlined) | The Task is executing. |
| Succeeded (green) | The Task finished successfully. |
| Failed (red) | The Task failed or errored. |
| Skipped (grey) | The Task is disabled. |
| Stopped Here (bright red) | Execution is paused at this Task. |
Tasks without a badge have not started yet.
Pause on a Task with breakpoints
A breakpoint pauses PIE the moment its Task starts.
- Add or remove: click the gutter at the far left of a row (a faint red dot appears on hover), press F9 on the selected Tasks, or use Toggle Breakpoint in the toolbar or right-click menu.
- Clear all for this asset: Ctrl+Shift+F9, or Clear Breakpoints in the right-click menu or Debug Target dropdown.
- When one is hit: PIE pauses, the FlowPilot Editor opens on the asset, and the Task is selected and marked Stopped Here. The debug bar reads
Stopped at 'Delay'.
INFO
Breakpoints last for the editor session: they are not saved in the asset.
Step, resume and stop
| Command | Shortcut | What it does |
|---|---|---|
| Resume | F5 | Continues PIE. |
| Pause | Pauses PIE without a breakpoint. | |
| Step | F10 | Continues and pauses again when the next Task starts, on the same FlowPilot Component. |
| Stop | Ends the PIE session. | |
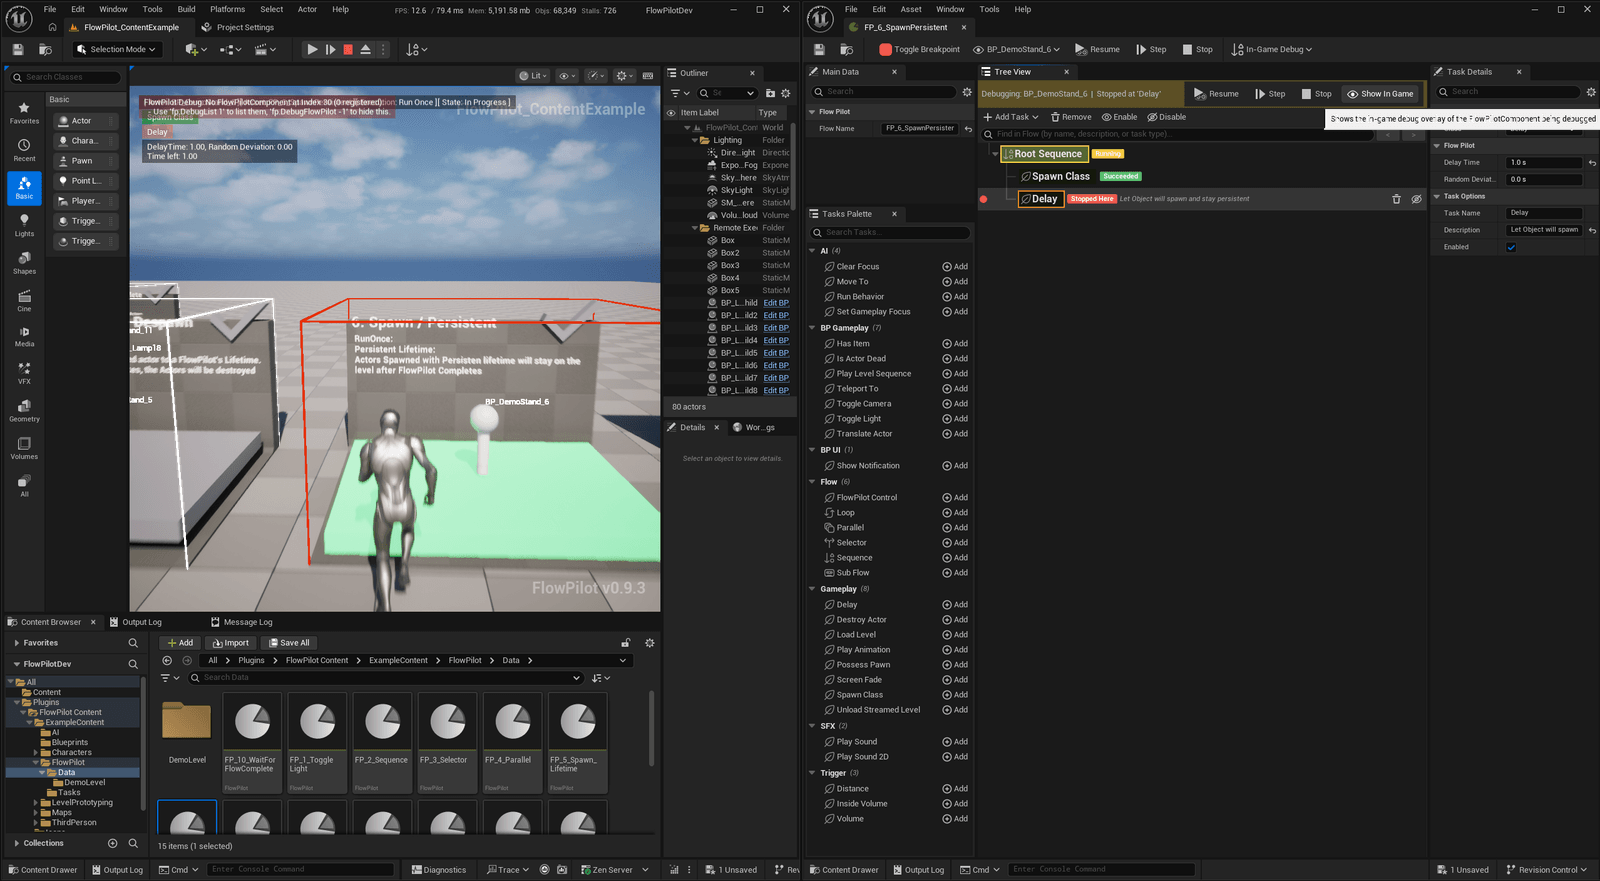
| Show In Game | Turns on the in-game overlay for the instance you are debugging. |
The buttons are in the FlowPilot editor toolbar and on the debug bar. Shortcuts work while the FlowPilot Editor has focus. Step waits for the next Task to start, so stepping past a 2 second Delay takes 2 seconds of game time.

See flows on screen with the in-game overlay
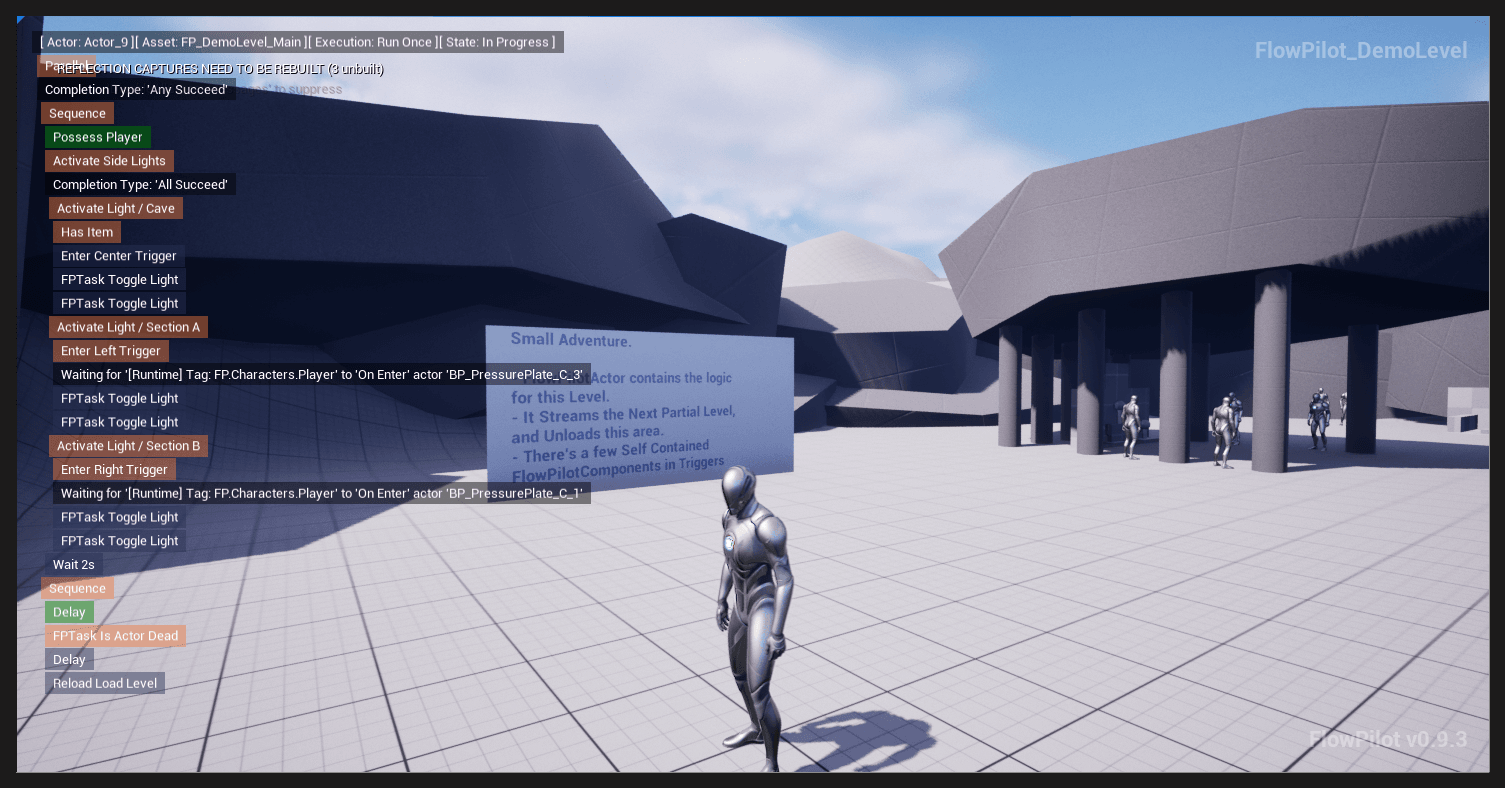
The overlay draws a FlowPilot Component's Task tree over the game view: running Tasks in orange, completed in green, queued in dark blue, with details such as Task: 2 / 4 or Loop 1/3 on active Tasks.
Turn it on from the FlowPilot dropdown in the Level Editor play toolbar, or In-Game Debug in the FlowPilot editor toolbar.
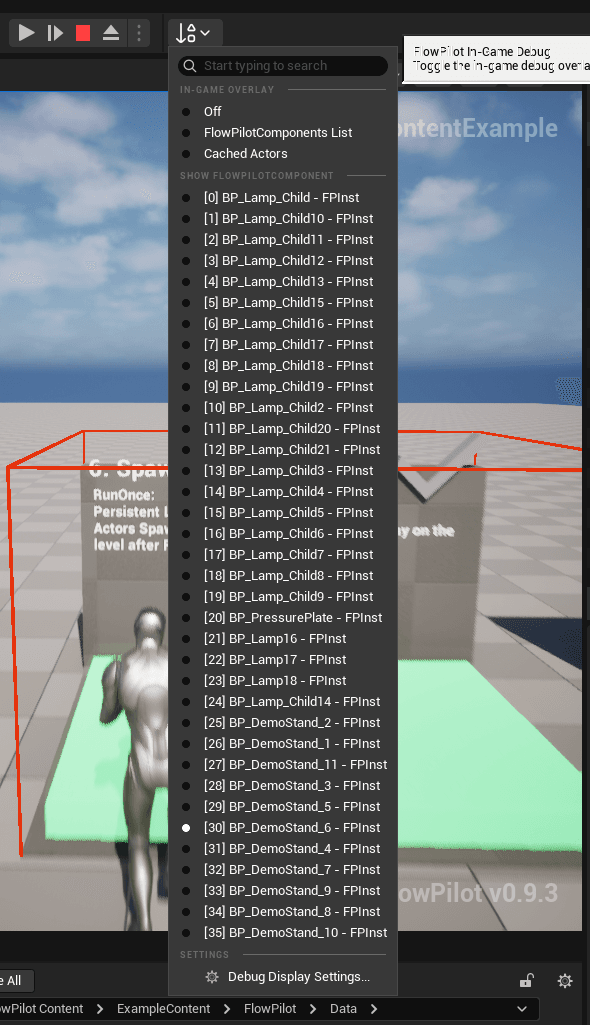
| Menu entry | Shows | Console command |
|---|---|---|
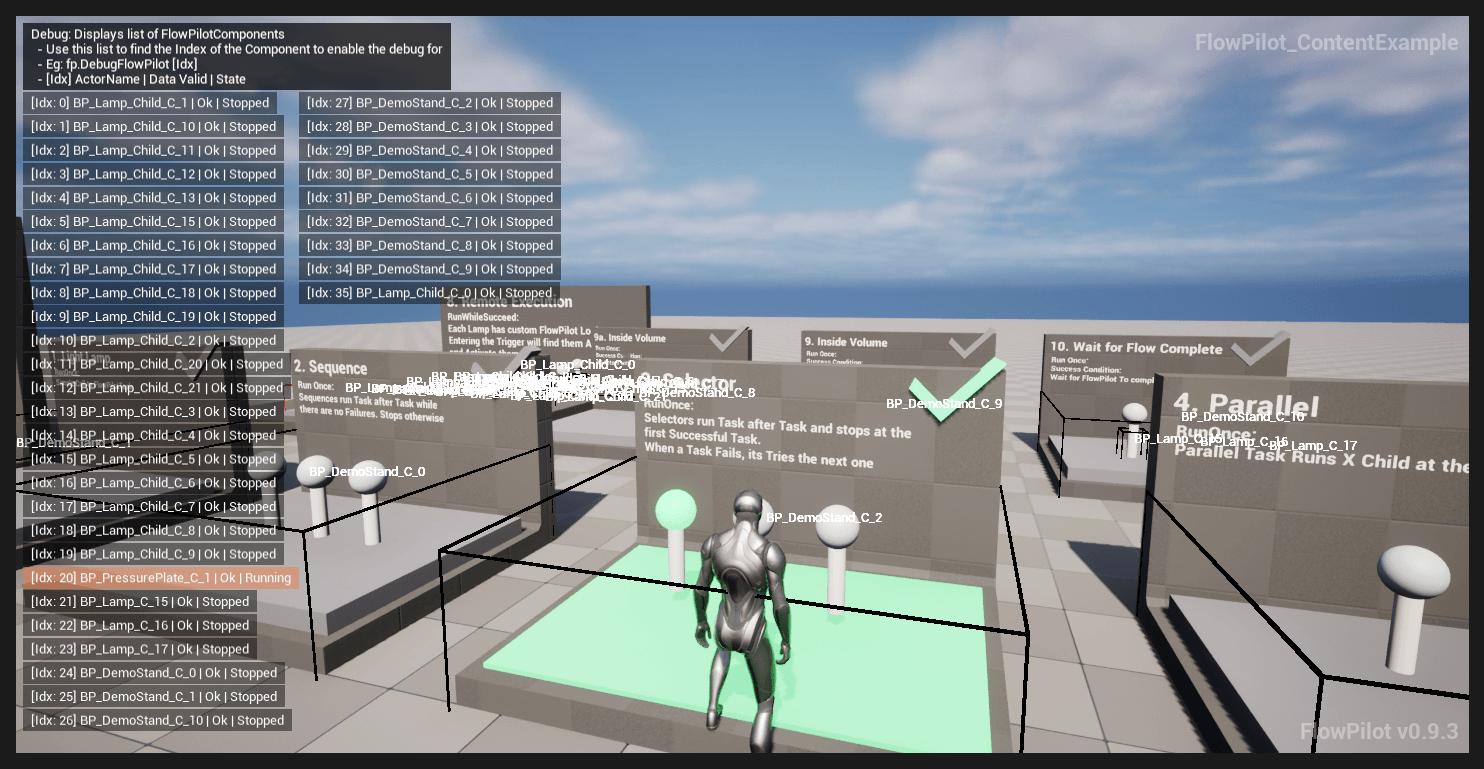
| FlowPilotComponents List | Every component with its flow, state and index. Their Actors are outlined in the level. | fp.DebugList 1 |
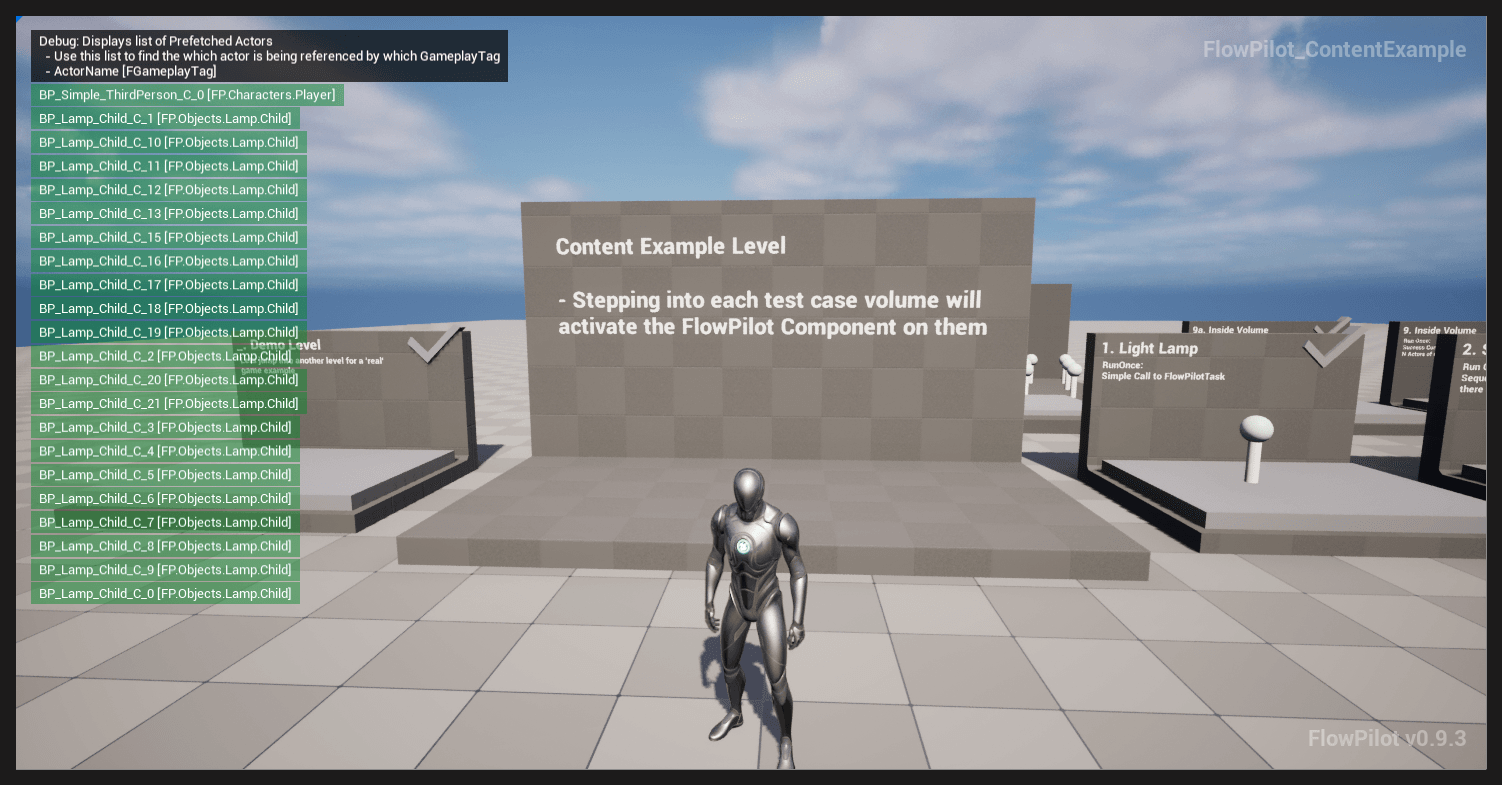
| Cached Actors | Actors cached by GameplayTag. | fp.DebugCache 1 |
[2] BP_Door - FP_DoorIntro | The Task tree of that component. The list fills in during PIE. | fp.DebugFlowPilot 2 |
| Off | Nothing. | fp.DebugFlowPilot -1 |
Only one overlay shows at a time. The console commands also work in packaged Development builds.
Tune the overlay
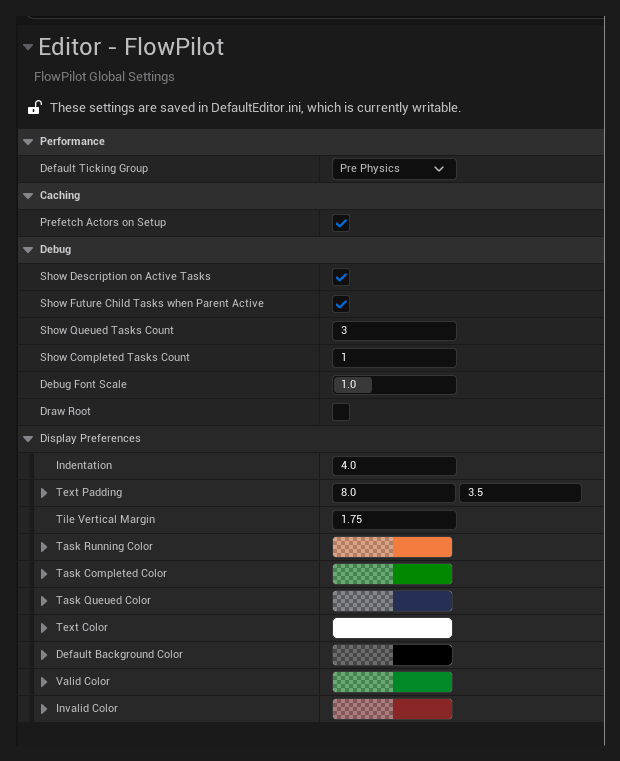
Debug Display Settings... at the bottom of the dropdown opens Project Settings › FlowPilot: font scale, colors, how many completed and queued Tasks to show, whether to draw the Root, and whether Task details show on active Tasks only. See Project Settings.
To hide the FlowPilot dropdown from the Level Editor toolbar, untick Show In Game Debug In Level Editor Toolbar in the FlowPilot Editor Preferences and restart the editor.